Why is basal temperature measured?
Unlike the standard temperature (measured under the armpit), which increases or decreases with the development of pathologies, basal temperature changes in healthy women over the course of a month. The rise and fall is influenced by the predominance of one of the hormones - progesterone or estrogen.
The temperature is measured mainly in the rectum (the indicators will be more accurate). It is possible to take measurements in the oral cavity or vagina.
Estrogen keeps the temperature in the rectum normal, and progesterone increases it. When ovulation occurs, the amount of estrogen in the blood increases, and the temperature decreases by 0.2-.03 degrees. After the fertilized egg is released, a corpus luteum is formed, which begins to produce progesterone.
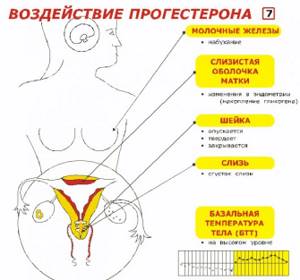
This leads to an increase in basal temperature. If fertilization of the egg does not occur, the corpus luteum dies, progesterone production decreases, and estrogen begins to predominate, which reduces the temperature to normal.
Taking into account the behavior of temperature during the menstrual cycle, gynecologists recommend drawing up a schedule of changes in indicators in the following cases:
- To determine the day of ovulation in order to calculate favorable days for conception. If protected, these will be dangerous days.
- If a woman is suspected of infertility. The schedule will allow you to determine whether ovulation is occurring;
- To identify disturbances in hormone production;
- To determine the onset of early pregnancy;
- To establish the development of the inflammatory process in the reproductive organs;
- To accurately determine the onset of menstruation;
- To determine the malfunction of the ovaries.
Based on the schedule, only a gynecologist can determine the presence of deviations. Self-diagnosis and treatment are not recommended. If there is a failure, the specialist will prescribe further examination. It is impossible to make a 100% accurate diagnosis based on the graph data.
BT chart online
Create a BT graph
Basal temperature (BT) is the lowest temperature value in the rectum or vagina (after a long rest).
Many women have heard more than once about the method of measuring BT, but not everyone has had to do it. This need arises during the diagnosis of infertility, when it is necessary to determine whether ovulation occurs (the release of an egg from the follicle) and on what days the body is ready to conceive. I would like to immediately note that in order to build a graph of basal temperature, it is necessary to measure it for 3-6 months (daily). The following factors may affect the accuracy of the data obtained:
- the presence of inflammatory processes, especially in the pelvic organs;
- physical activity (basal temperature is measured after 3-6 hours of sleep);
- serviceability of the thermometer;
- stressful situations;
- sudden fluctuations in weight;
- infectious diseases, injuries, burns, poisoning.
How are the menstrual cycle and basal temperature (BT) related?
The menstrual cycle consists of several phases, each of which has its own characteristics.
The main changes occur at the hormonal level, resulting in the maturation of follicles, the release of the egg from the ovary and the rejection of the endometrium of the uterus during menstruation. All these changes are correspondingly reflected in the value of basal temperature. If women take a responsible approach to the process of charting, they will be able to determine the day of ovulation and even the day of conception with maximum accuracy. In the first half of the menstrual cycle, the basal temperature does not exceed 37.00 C: at the beginning of menstruation it stays between 36.3-36.50 C, and this continues until the last day of menstrual flow (3-6 days).
After menstruation, a woman’s ovary begins to actively undergo the process of maturation of follicles, among which one (dominant) will be isolated, and the egg will mature within it. During this period, the basal temperature increases slightly - reaches 36.7-36.90 C. Before ovulation it decreases to 36.30 C, and on the days most favorable for conception - it rises again (ranges from 37.1 -37.30 WITH). And only 1-2 days before menstruation, the basal temperature drops to 36.7-36.80 C. If conception has occurred, then this will not happen before the expected start date of menstrual bleeding (BT value will be in the range of 37.3-37.40 C ).
Changes in basal temperature are associated with hormonal fluctuations and blood flow to the woman’s genital organs, so it is important to measure it in the right place - in the rectum. Under the influence of certain female sex hormones, the degree of blood supply to the genital organs and adjacent tissues changes, which allows the thermometer to be recorded.
What can affect the accuracy of the data obtained?
The reliability of the data obtained when plotting basal temperature charts depends on the following factors:
- the presence of inflammatory processes, especially in the pelvic organs;
- stress;
- duration of rest (at least 3-6 hours);
- physical activity (immediately before measuring BT);
- consumption of spicy foods, alcohol;
- The thermometer is working properly.
Measuring basal temperature is a long but informative way to determine days with high fertility. Using this technique, women can find out when they are most likely to conceive. In addition, this method formed the basis of natural contraception. If you have a regular menstrual cycle and know the day of ovulation, then you can determine conditionally safe days when you can be sexually active without using contraceptives. Just don’t rely too much on this method, since the likelihood of pregnancy is high: weather changes, stress, hormonal fluctuations, changes in diet, hypothermia - all this can shift the date of ovulation.
What do you need to know when measuring basal temperature (BT) and charting?
- Throughout the entire period of plotting basal temperature charts, use the same thermometer. Don't forget to shake it off after recording the data.
- BT is measured only after 3-6 hours of sleep, strictly without leaving bed. It is very important! If you got up the day before waking up and plan to sleep a little more later, measure your BT immediately to get the most reliable data.
- In case of inflammatory processes of the pelvic organs, colds, and flu, basal temperature values may be overestimated.
- Keep the glass thermometer in the rectum for up to 5-7 minutes. It provides more accurate information than electronic. But be careful with glass thermometers - they are easy to break.
- Try to measure BT at the same hour - this will increase the reliability of the data obtained.
- Without understanding changes in BT, do not attempt to evaluate the basal temperature chart yourself. It is better to contact an experienced gynecologist or reproductive specialist for detailed advice.
What can you learn from basal temperature charts?
Plotting a basal temperature chart allows you to:
- find out the days of your maximum fertility (ability to conceive);
- determine whether a woman is ovulating;
- find out which days are “safe” for intimacy (in order to prevent unwanted pregnancy);
- suspect the presence of an inflammatory process in the uterus, ovaries or vagina;
- provide the gynecologist with information about the course of the menstrual cycle.
The basal temperature chart is convenient and easy to study.
All you need to do is take a responsible approach when filling out the calendar. If you wish, you will quickly learn how to make your own charts and use them without the help of a specialist. But it is worth understanding that the method of determining ovulation by basal temperature is quite subjective. If you are not ready to measure your BT every day for 3 or more months, following all the rules and taking into account the recommendations, then you should not waste your time. The method is suitable for responsible women with a stable menstrual cycle, without acute inflammatory processes. Build a BT chart
To decipher graphs with examples, use the basal temperature section. You can discuss your chart on the forum about maintaining group basal temperature charts.
Training video on how to plot basal temperature
Types of thermometers for measuring basal temperature. Criterias of choice
To determine body temperature, 3 types of thermometers are used (mercury, electronic, infrared). They can be used to measure values in the rectum (oral cavity, vagina). Each thermometer has its own pros and cons in use.

Criteria for choosing a thermometer for measuring basal temperature:
| Type of thermometer | Advantages of the device | Disadvantages of the device |
| Mercury | Has high accuracy of temperature readings. | It is dangerous due to its mercury content (if broken, you can be poisoned by metal vapors). When measuring temperature, you need to wait 5 minutes. The thermometer is made of thin glass and can break easily. Not only mercury poses a danger, but also small particles of glass. |
| Electronic | The thermometer is flexible and easy to use. When measuring temperature, a beep sounds. The measuring time is no more than 1 minute. The temperature indicator is displayed on a digital display. Consists of a metal tip on rubber and a plastic body, which ensures durability. | The measurement error can be up to 0.2 degrees. This deviation will not allow you to build an accurate basal temperature graph. |
| Infrared | Temperature measurement time 1-3 seconds. Contactless models available. When taking measurements, there is no need to insert the thermometer into the anus, mouth or vagina. All you need to do is point the laser at the desired area. | The temperature indicator is displayed with an error of up to 0.5 degrees. Such a deviation will not allow constructing a correct graph. The device is not recommended for measuring basal temperature. |
For measuring the temperature in the rectum, the ideal option, in terms of accuracy, is a mercury thermometer, and in terms of ease of use, an electronic one. If the choice is made on an electronic model, then you need to choose an expensive and high-quality model. Before use, test for errors (compare the readings of a mercury thermometer and an electronic one).
Rules for measuring basal temperature
Basal temperature (graphs will be constructed accurately if all measurement rules are taken into account) throughout the entire measurement period should be measured with the 1st thermometer. And also in 1st place. Gynecologists recommend measuring basal temperature in the rectum. There will be discomfort in the vagina during menstruation, and in the oral cavity a slight runny nose can distort the accuracy.
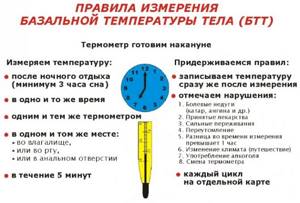
Rules for accurately measuring basal temperature:
- Measure daily, at the same time, even on weekends.
- The thermometer should be near the bed, and the mercury thermometer should be shaken in the evening.
- The rest time should not be less than 6 hours.
- After waking up, immediately measure your temperature, without unnecessary movements or trips to the toilet. The last visit to the toilet should be 3 hours before waking up.
- The duration of temperature measurement with a mercury thermometer should be 5 minutes, without deviations. An electronic device and an infrared signal indicate that the measurement is ready.

- Temperatures begin to be measured on the 1st day of the menstrual cycle. During the period of menstrual flow, the procedure does not stop.
- The temperature measurement period lasts from 3 to 4 menstrual cycles.
- If the column on a mercury thermometer stops in the middle of 2 digits, then you need to take the lower result.
- All necessary data is entered into a table to construct a curve.
When measuring the temperature in the oral cavity, the lips should be tightly closed. The end of the thermometer should be located under the tongue. The intake of fresh air through the mouth will distort the accuracy of the measurement. When placing the device into the anus or vagina, it should extend 3-5 cm.
How to measure basal temperature to determine ovulation?
There are a number of requirements for how to measure basal temperature. Most often they resort to the rectal method (a thermometer is inserted into the rectum).
- Take your temperature at the same time every day. However, it is important that you sleep for at least 6 hours before taking measurements. Measurements are taken while lying down, without getting out of bed, in a calm state. Preference is given to morning time. You can measure BT during the day, but, firstly, it is difficult to get 6 hours of sleep beforehand, and secondly, the results are not always correct.
- To eliminate error, use the same thermometer. You need to hold it for at least five minutes.
- Start measurements from the beginning of the cycle, that is, from the first day of your period. You can collect data at other times, but this is the best option.
- Measure BT for at least three cycles. Only then will the data be informative and reliable.
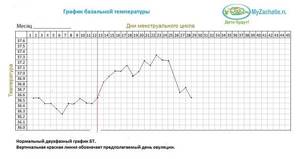
The received data must be recorded. The most convenient way is to enter them in a special table - it can be easily found on the website and printed. Based on the data in the table, a BT chart is constructed. This is a curve that reflects two phases - follicular and luteal.
If your body temperature has increased, a chronic disease has worsened, or you have recently returned from a long trip, then the measurement results will not be indicative. The same can be said about taking hormonal and sedative drugs. If you drank alcohol or had sex 4 hours before the measurement, the data will also be unreliable.
What should be included in the BT table?
Before constructing a graph, it is necessary to enter all data into a table. The sheet should contain: the graph itself, a table below it, and an explanation below.
Basic data for creating a table:
- Date of the month.
- Day of the menstrual cycle.
- Basal temperature value.
- Temperature measurement time. It is important if it is not always possible to carry out the measurement at the same time.
- Note box. It contains factors that influence changes in temperature:
- rest less than 6 hours;
- drinking alcohol or having sex in the evening;
- characteristics of discharge during menstruation;
- increase in general temperature due to illness;
- severe stress;

- increased physical activity in the evening;
- bowel dysfunction (diarrhea or constipation). It is important if the measurement is performed rectally;
- taking medications;
- severe fatigue;
- time zone change;
- visiting a bathhouse or sauna in the evening;
- overeating before going to bed.
The gynecologist, when assessing the graph, pays attention to the explanation of the reason for the temperature change. Without notes, a specialist will misinterpret the data. For the correct presentation of the table and graph, the treating gynecologist has a sample.
Norms of BT indicators throughout the cycle, during pregnancy
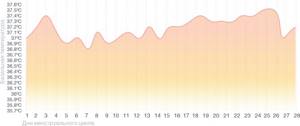
When an egg is fertilized, the graph of the base temperature curve changes. The pre-ovulation phase proceeds without changes. After the release of the egg, the temperature begins to rise and can reach 37.4 degrees by the end of the menstrual cycle.
There is no decrease in indicators 2-6 days before the onset of menstrual flow. Confirmation of pregnancy is a decrease in temperature (by 0.1-0.3 degrees) on the 6th or 7th day after ovulation, and lasts up to 2 days. This occurs as a result of implantation of the embryo into the uterus.
Further, the temperature remains stable at 37.1-37.4 degrees until 14-16 weeks of pregnancy. From 15-17 weeks, the hormone progesterone decreases, which leads to a decrease in temperature to 36.8-37 degrees. There is no decrease to the normal value, 36.6 degrees, until the baby is born.
Measuring basal temperature is recommended up to 18 weeks. Since before this period, frozen pregnancies or miscarriages occur, which are accompanied by a decrease in basal temperature. From the 19th week, measuring basal temperature is canceled.
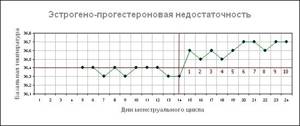
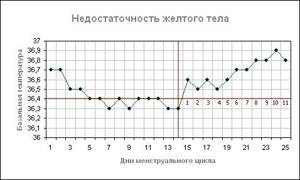
For estrogen-progesterone deficiency
If there is a simultaneous lack of two important hormones : estrogen and progesterone, there is a slight increase in temperature in the second phase (by 0.1–0.3 °C), and the release of the egg has a slight increase in indicators.
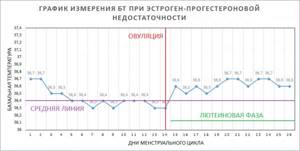
If you have such a schedule, you should visit a gynecologist. After the examination, the specialist will prescribe appropriate treatment aimed at restoring hormonal levels .
Decoding basal temperature charts
Basal temperature (graphs are deciphered by a gynecologist), correctly measured and recorded taking into account the factors influencing its increase, allows you to determine deviations in ovulation, the presence of pregnancy or an inflammatory process. Changes are assessed based on indicators that characterize disturbances in the menstrual cycle.
Covering line
The plotting of the graph begins with the covering (middle) line. It does not show the presence of deviations, but with its help it is more convenient to track the dynamics of temperature changes.
A line is drawn after there are 6-7 entries in the table. A straight line is drawn horizontally, at the level of the temperature value on the 6th day (only if the measurement was taken on that day, correctly, and there were no provoking factors).
Ovulation line
The ovulation line allows you to divide the graph into 2 phases . To apply it, 3 temperature indicators (marked one after another) are monitored over the center line. A vertical line is drawn in front of them.

By tracking basal temperature for more than 4 cycles, it is determined on which day of the menstrual cycle ovulation occurs.
Menstrual cycle length
Additionally, using the graph, you can track the length of the menstrual cycle (its fluctuations, if any). The graph curve begins to be built from the 1st day of the menstrual cycle and ends before the start of the next menstruation.
Second phase length
The duration of the 2nd phase plays an important role in bearing a child. On the graph it is located after the ovulation line. Normally, its duration should be in the range of 12-16 days and not change, even if the menstrual cycle has lengthened.
An increase or decrease in the number of days in menstruation can occur due to the 1st phase, which on the graph is located before the ovulation line.
What should be a normal basal temperature?
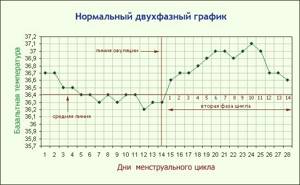
Normally, basal temperature changes throughout the entire cycle, and the graph turns out to be two-phase.
The duration of the cycle and the length of each phase are different for each woman, so we give approximate, indicative figures.
During menstruation, BT is usually 36.7-37 degrees. When the bleeding stops, the temperature drops slightly. In the first phase of the monthly cycle (from 1 to 10-15 days), a woman has high levels of estrogen and low levels of progesterone. Immediately after menstruation, the normal basal temperature is low. In a healthy woman it rarely rises above 36.6.
Before ovulation it may decrease slightly. And after ovulation it rises to 37 and above. The difference between the phases is 0.4-0.8 degrees.
Normally, basal temperature may drop slightly before your period. If this does not happen, this may indicate both individual characteristics and a possible pregnancy.
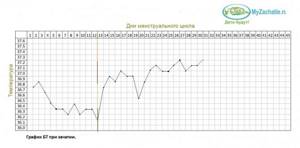
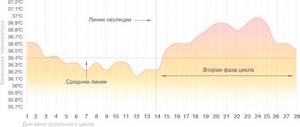
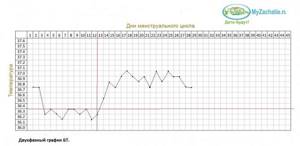
Here is an example of a basal temperature chart.
If your graph is similar to the one in the picture, then most likely you are ovulating and your ovaries are working correctly. If there are deviations, if there is no clear rise in temperature in the second phase of the cycle, this may indicate (although not necessarily) some hormonal problems.
BT for various pathologies
Basal temperature (graphs allow you to determine deviations in the production of hormones and the presence of an inflammatory process), its changes indicate the presence of pathologies.
Anovulatory cycle
In a normal menstrual cycle, the schedule is divided into two phases: before and after ovulation. In the 1st phase, the temperature does not exceed 36.5 degrees. After ovulation (2nd phase), due to the formation of the corpus luteum, progesterone is produced, resulting in an increase in temperature.
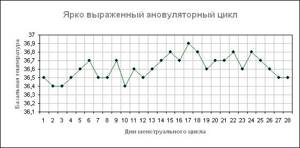
Basal temperature chart for an anovulatory cycle
When the graph curve is uniform and does not have a characteristic decrease in temperature the day before ovulation and a subsequent increase, it means that the egg has not been released from the ovary.
This phenomenon is considered normal if it occurs up to 2 times a year. More frequent manifestations characterize the development of pathology. Until the problem is eliminated, pregnancy will not develop. In women over 40 years of age, anovulatory cycles may occur more frequently.
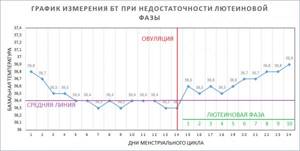
Estrogen-progesterone deficiency
When the temperature range on the graph has a difference of no more than 0.4 degrees and there is no decrease in temperature before the release of the egg, this means insufficient production of estrogen and progesterone.
In this case, ovulation occurs and pregnancy may occur, but there will not be enough hormones to maintain it. An early miscarriage will occur. If these abnormalities are detected, you should contact a gynecologist. He will schedule a blood test at a certain period. Hormonal drugs are prescribed for treatment.
Short second phase
When the length of the 2nd phase is less than 12 days, this means insufficient progesterone production due to improper development of the corpus luteum. If the hormone is deficient, the fertilized egg will not be able to attach to the uterus. Without treatment with hormones, a woman will not become pregnant.
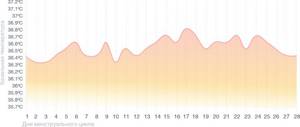
Estrogen deficiency
A lack of estrogen, when plotting a graph, will be marked by elevated temperature from the 1st day of the menstrual cycle (above 36.7 degrees), in the 2nd phase the indicator can rise to 37.5 degrees. If these hormones are deficient, pregnancy is unlikely.
Ovulation is practically not traceable due to the smooth transition of the menstrual cycle from the 1st phase to the 2nd. For treatment, the gynecologist prescribes a course of hormone therapy.
Inflammation of the appendages
During the inflammatory process in the reproductive organs, an increase in temperature is also observed from the 1st day of the 1st phase of the cycle. But it does not last all the time; there are sharp decreases, only in the 1st phase.
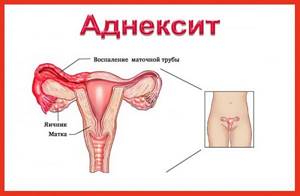
In the second phase, the temperature remains above standard and can reach 37.5 degrees. Additionally, foreign vaginal discharge is noted. Treatment is prescribed after a complete examination.
Signs of pregnancy and its absence on the BT chart
During conception, basal temperature rises. The indicators do not decrease before the onset of menstruation and remain throughout the entire gestation period.
Pregnancy can be determined according to the schedule by a jump in temperature on the 7-10th day after ovulation - this is the moment the fertilized egg is implanted into the inner lining of the uterus.
Sometimes early or late implantation is observed. Even the most informative ultrasound examination cannot reliably track this process.
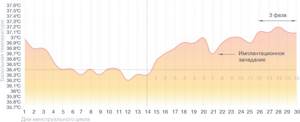
A sharp decrease in temperature on the graph in the second phase is called implantation retraction. This is one of the first and most common signs noted on the basal chart with a confirmed pregnancy.
This phenomenon is due to two reasons.
- Increased production of progesterone increases the temperature, which gradually decreases closer to the middle of the luteal phase. During conception, the corpus luteum begins to actively synthesize the hormone, which leads to fluctuations in values.
- If pregnancy occurs, then a large amount of estrogen is released, which causes a sharp decrease in temperature in the diagram.
The combination of hormones with different functions leads to a shift, which manifests itself in the form of implantation retraction on the personal map.
This phenomenon cannot be reflected by any other study other than the basal temperature curve. Example:
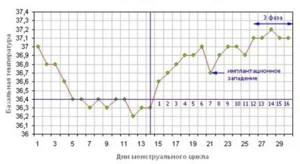
Implantation retraction
Please note that during pregnancy, starting from the 26th day of the menstrual cycle, the schedule becomes three-phase. This is explained by increased synthesis of progesterone after egg implantation.
Confirmation of the implantation of the embryo may be minor discharge that disappears in 1–2 days. This is implantation bleeding, which is caused by damage to the endometrium.
Nausea, breast swelling, intestinal disorders and other similar signs are not reliable. There are cases when, even with severe manifestations of toxicosis, pregnancy did not occur.
And, on the contrary, without a single sign, the woman was stated to have successfully conceived. Therefore, the most reliable conclusions are considered to be a persistent increase in basal temperature and implantation retraction. Another sign is a delay in menstruation if you have sexual intercourse during the period of ovulation.
A decrease in temperature before menstruation is a sign of absence of pregnancy. Fluctuations in rectal numbers can be interpreted in different ways. A high temperature is not always a sign of pregnancy. This is possible due to inflammation of the appendages.
Each case must be compared with all changes in the body and confirm your observations in the gynecologist’s office.
It is important to record data regularly
Basal temperature charts during pregnancy
Basal temperature (charts must continue to be drawn up even if pregnancy occurs) during the period of bearing a child allows you to determine the threat of miscarriage, frozen pregnancy and the development of the inflammatory process.
What does the graph show during pregnancy?
During the period of conception, the basal temperature increases after ovulation and remains at around 37.4 degrees almost until the middle of the term. Further, the amount of progesterone in the blood decreases, since the fetus already has a placenta, which ensures further bearing of the child.
The corpus luteum dies. As a result, the temperature drops to 36.8-37 degrees. This range of indicators remains until childbirth.
During an ectopic pregnancy, an increase in basal temperature occurs, since the fetus developing outside the uterine cavity provokes the development of an inflammatory process. An increase may also mean inflammation of the appendages. But at the same time, the basal temperature will either rise or fall. With an ectopic pregnancy, it will remain constantly high.
When the fetus freezes, the temperature will begin to decrease and gradually reach normal temperatures. This occurs due to a decrease in progesterone levels. After the death of the embryo, the corpus luteum dies off, since there is no need to maintain the safety of the pregnancy. Gynecologists advise continuing to measure basal temperature until the 20th week to exclude developmental pathologies.
Corpus luteum deficiency
With insufficiency of the corpus luteum, progesterone production decreases. It is necessary for the preservation and normal course of pregnancy until the embryo forms a placenta. This change threatens miscarriage.
On the graph, this pathology is reflected by a decrease in basal temperature to 36.9 degrees. Pathology most often develops in women who had a short 2nd phase before conceiving a child.
Estrogen-progesterone deficiency
Lack of estrogen and progesterone in most cases results in miscarriage at up to 8 weeks. In this case, the curve on the graph during pregnancy may not reflect the presence of pathology. Lack of hormones can be detected in a laboratory way (blood donation for hormones).
Hyperprolactinemia
An increase in basal temperature can occur with increased production of prolactin. This pathology can occur due to hormonal imbalance in the body (after a late miscarriage, severe stress) and during breastfeeding. With hyperprollactinemia, a complete absence of menstruation is possible.
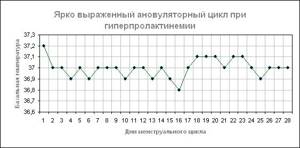
On the graph, the curve may completely correspond to the curve during pregnancy.
What can you learn from the graph?
Now let's get down to the most interesting part - we'll learn how to decipher your notes and figure out how to use your notes to determine safe days on which you can safely have sex without worrying about undesirable consequences. During the period of egg maturation, the level of estrogen in the female body increases, which immediately affects BBT - it is low and practically does not change. Just before the egg leaves the follicle, the thermometer readings drop to a minimum, then the very next day they rapidly increase. This is a signal of ovulation - everything is ready for conception and it is enough to make a little effort to rejoice at the double line seen on the test in a few days. Of course, provided that you do not have serious health complications.
If you carefully monitor your BT and draw a chart in which you enter all the data long before conception, then you can determine a joyful event for yourself without a test. In addition to the first signal (no period), calendar entries will help you. In the early stages of pregnancy, the thermometer readings will remain practically unchanged - within 37 degrees. For the second and third trimester, it is normal to regularly observe 36.6-36.9 degrees on the thermometer. By the way, in the later stages the curve of the graph may creep up sharply - this may be a signal of an imminent birth. Of course, during pregnancy it is better not to rely entirely on measurement data - every female body, when carrying a baby, can react with an increase in temperature to any external or internal factor.
Basal temperature chart for ovulation stimulation
Basal temperature (graphs are necessary when stimulating the ovaries) allows you to determine the correct selection of the drug and determine the day of ovulation in order to collect the egg for further fertilization. To even out the cycle, clomiphene is used in the 1st phase, and duphaston in the 2nd.
During stimulation, the curve in the graph clearly reflects the 1st and 2nd phases with the desired decrease in temperature before ovulation. When the 2nd phase occurs, the correct temperature increase is monitored. Deviation of the schedule from the norm indicates the need to change the dosage of the drug or replace it.
When to contact a gynecologist?
To determine the correct functioning of the reproductive system, it is necessary to plot the basal temperature for at least 4 cycles. The data obtained should be shown to a gynecologist; only a specialist will be able, using the curve from the graph, to make a preliminary diagnosis and prescribe the necessary further examination.

Under what conditions and additional symptoms should you immediately contact a gynecologist:
| Graph Data | Additional symptoms |
| Having an anovular cycle more than twice every 12 months. | Pregnancy does not occur. Possible absence of menstruation. |
| The duration of the 2nd phase is 11 days or less. | Change in the nature of menstruation, heavy or scanty, lack of conception. |
| The duration of the menstrual cycle is less than 20 days and more than 36 days. | No pregnancy, profuse discharge with a large number of clots. |
| Instability of the menstrual cycle. | The presence of intermenstrual discharge, pain and fever. |
| The curve has slight deviations, while the basal temperature itself is higher than normal. | Lack of pregnancy or frequent miscarriages. Possible failure of menstruation or absence of menstrual flow. |
| Strong temperature changes in the 1st phase of the cycle | Pain in the appendage area, additional vaginal discharge |
| Changes in basal temperature indicators, upward or downward, during pregnancy. | Pain in the lower abdomen and bleeding. |
You also need to consult a specialist if the basal temperature measurement schedule is without deviations, but there is no pregnancy. Making a diagnosis on your own and starting treatment is dangerous and can result in complete infertility.
What should a basal schedule look like when preparing for pregnancy?
Describing how basal temperature changes during the menstrual cycle is useful information, but can be difficult to understand without specific examples. So let's look at some graphs that visually show what measurements you can get.
Normal menstrual cycle
Normal menstrual cycle schedule
During the normal course of the menstrual cycle, you can see two different phases on the graph - in the first, the average level of basal temperature is lower than in the second, and ovulation serves as their boundary. It is not necessary that your schedule is divided into two equal parts of 14 days, as in this example. The duration of the second phase of the cycle for different women can be from 12 to 16 days, and the first can vary within even wider limits. There is nothing unusual in this, just the individual characteristics of the body. However, different cycles of a particular woman should follow the same scenario. After a couple of months of measurements, you will already roughly understand what day of the cycle ovulation should occur.
This graph gives an understanding of what basal temperature is normally observed in preparation for pregnancy. In the second phase it should be 0.3–0.6 °C higher than the average level of the first period. At the same time, a drop in the temperature curve is observed at the end of the cycle, before the onset of menstruation. And, of course, the preovulatory drop followed by a rise is important for the expectant mother.
Anovulatory cycle
Anovulatory cycle chart
In the anovulatory cycle, ovulation does not occur, and hormonal levels change slightly. Throughout the entire cycle, the basal temperature remains almost at the same level - around 36.6 ° C, and the graph does not show pronounced phases and drops that are observed in a normal menstrual cycle.
If your temperature curve looks like this in the first month of measurements, there is no need to panic. Every woman has one anovulatory cycle per year, sometimes more. It’s just that your reproductive system periodically needs rest, and it arranges it for itself during periods during which it is impossible to get pregnant. However, if such a picture is observed for more than two months in a row, you need to consult a doctor - this is no longer a rest, but a possible sign of infertility.
Hormonal problems
Let's look at what a basal temperature graph might look like for various hormonal disorders.
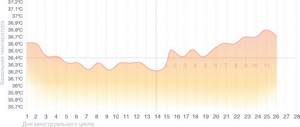
Diagram for corpus luteum deficiency
The corpus luteum forms after ovulation and produces progesterone, which is necessary to prepare the endometrium for implantation of a fertilized egg. If the corpus luteum produces little progesterone, an already begun pregnancy may be terminated.
This condition can be calculated by the slow rise in temperature in the second phase, and for its treatment the doctor will prescribe hormonal drugs.
Schedule for estrogen deficiency
If a high level of progesterone leads to an increase in basal temperature, then an increase in estrogen production leads to a decrease in it. It is thanks to them that the temperature drops before ovulation. With estrogen deficiency, the likelihood of fertilization decreases significantly.
This condition can be identified by an unexpectedly high temperature at the beginning of the cycle, a slow increase in the middle, and a temperature above normal for the second phase. It will not be possible to detect ovulation using such a schedule. In case of estrogen deficiency, hormonal medications are also prescribed.
Pregnancy
Schedule during pregnancy
You determined the day of ovulation using measurements, you have already had that same sex. Keep monitoring - you may soon be able to detect pregnancy even before the test shows two lines!
In early pregnancy, basal temperature drops on the day when the egg implants. The characteristic implantation retraction divides the second phase into two, and a third phase appears in your chart, indicating that pregnancy has begun. It is worth remembering possible inaccuracies in measurements and it is better to wait until your doctor confirms this joyful fact. But, most likely, you can already be congratulated - you have begun your journey to becoming the best mother to the best baby in the world!
Signs of probable infertility according to the basal temperature chart
When examining the temperature chart, a gynecologist can make a preliminary diagnosis of infertility in the following cases:
- the duration of the 2nd phase is less than 9 days;
- the duration of the temperature increase during the ovulation period is more than 4 days;
- large fluctuations in basal temperature in the 2nd phase of the cycle.

To clarify the diagnosis, it is necessary to undergo a full examination and then build a graph.
In case of corpus luteum deficiency
After ovulation has occurred, the luteal stage begins to operate; it is also called the corpus luteum phase , which is formed at the site of the burst follicle and produces progesterone, the pregnancy hormone. Its main function is to prepare the endometrium for implantation of a fertilized egg, and it is also responsible for supporting the luteal phase. Its deficiency affects reproductive function.
On the graph, corpus luteum deficiency is expressed by a slight increase in temperature in the period after ovulation, and before menstruation there is no decrease in values. And also confirmation of the insufficiency of the luteal phase is the short duration .
Normally, it should be from 12 to 16 days, ideally 14 days. If the duration exceeds 16 days, then this may indicate pregnancy, an inflammatory process, as well as the formation of a corpus luteum cyst.
REFERENCE! If progesterone is low, experts prescribe hormonal medications such as Utrozhestan or Duphaston. The classic regimen is from days 16 to 25 of the cycle.
Determining pregnancy by basal temperature
To determine the occurrence of pregnancy, it is necessary to maintain a schedule for at least 3 cycles before the planned conception. To measure temperature, it is advisable to choose the rectal method, it is accurate and a mercury thermometer. When measuring, follow all rules. Be sure to note the accompanying factors that influence the construction of the graph.
A drawing showing the pregnancy cycle will show a slight decrease in temperature before ovulation and a gradual increase after 2-3 days. The temperature range is 37.1-37.5. By the end of the cycle, the temperature does not decrease. A drop in temperature early in pregnancy signals the onset of a miscarriage.
Basal temperature helps to quickly and reliably identify changes in the reproductive system without the use of equipment. To clarify the pathology, the graphics need to be shown to a gynecologist. It is advisable to continue recording data in a table and constructing a temperature curve during pregnancy, especially if there is a possibility of miscarriage.
Author: Kotlyachkova Svetlana
Article design: Mila Friedan
Ovulation retraction
Approximately 2-3 days before the release of a mature gamete from the ovary, the so-called ovulation relapse is recorded on the graph - a decrease in basal temperature by 0.1 - 0.3 degrees. This is approximately days 11-13 of the cycle, when the follicle reaches its maximum size and is preparing to burst. The depression lasts only a day (sometimes several hours), after which the indicators return to their previous level.
Women are not always able to record the retraction on the graph. It happens that it is too short in time and does not coincide with the moment the temperature is measured. It happens that it is not there due to individual characteristics. So a schedule without ovulation relapse can also be considered normal, if, of course, other parameters do not go beyond normal limits.
Ovulation itself is characterized by a sharp increase in temperature in the rectum by 0.4-0.6 degrees, after which it is customary to talk about the onset of the second luteal phase. Throughout its entire length, BT is kept within the range from 36.8 to 37.3 degrees, which averages 37.0 degrees Celsius.
Only in the case of productive fertilization of a woman’s egg with the sperm of her partner, on days 7-12 after conception, is there a decrease in temperature followed by its rise, which in time corresponds to the attachment of the fertilized egg to the endometrium and is called implantation retraction.